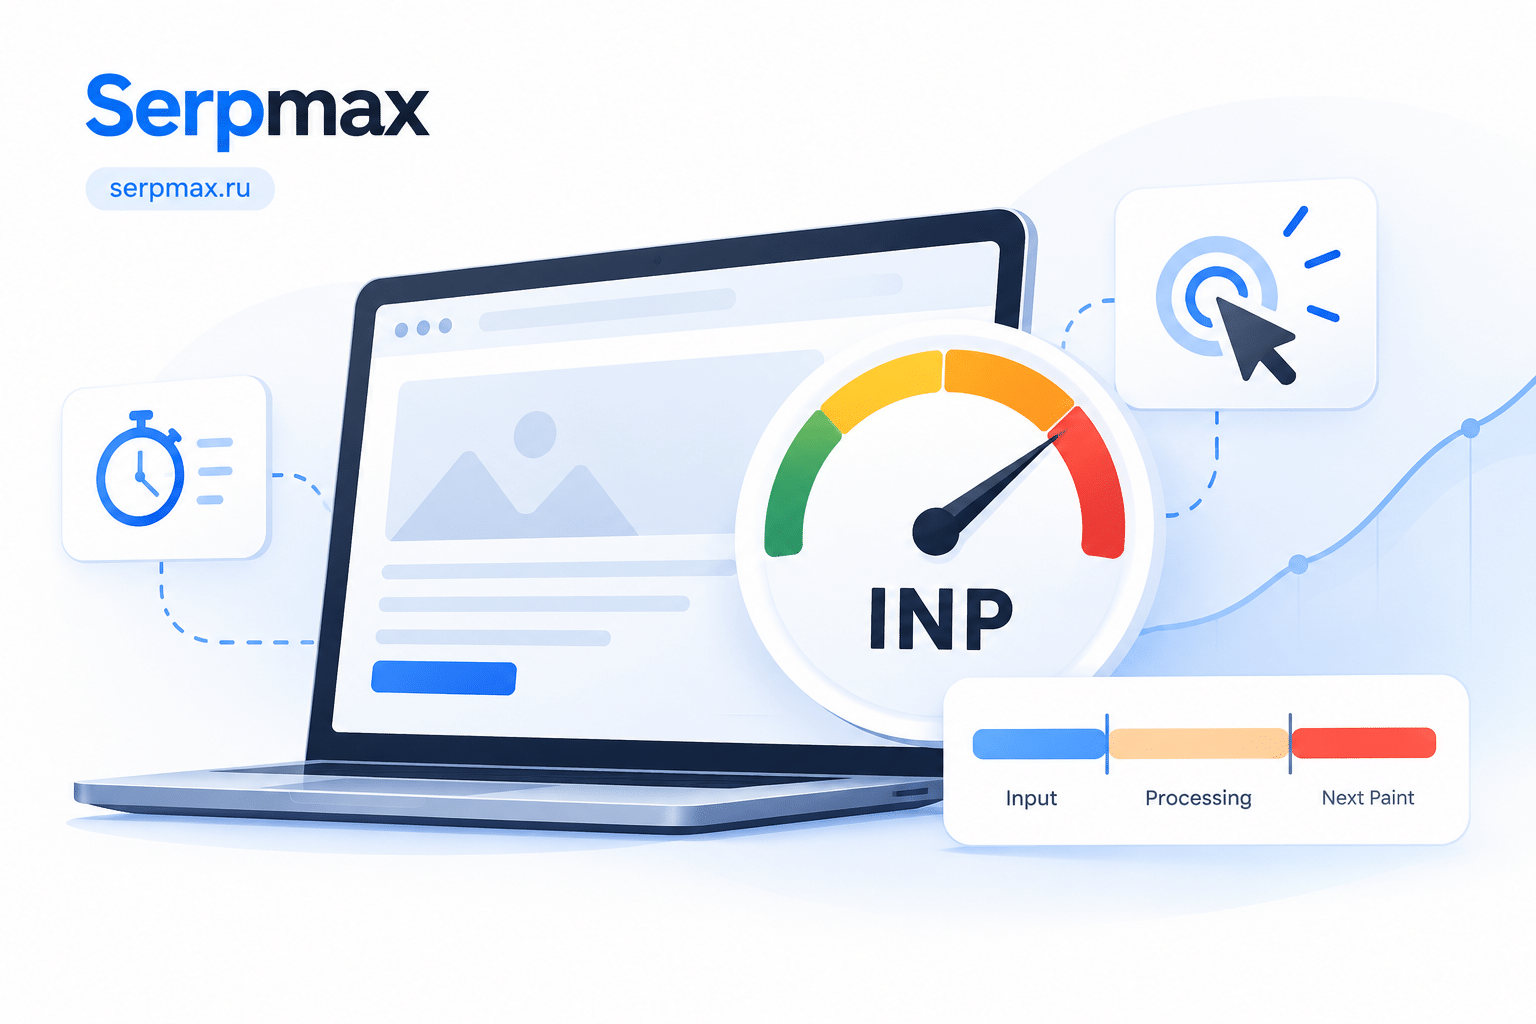
Your INP score is high. Users click, tap or type, and the page responds slowly. This is frustrating and hurts Core Web Vitals. INP (Interaction to Next Paint) measures how quickly the page responds to user interactions. A high INP usually points to heavy JavaScript, long tasks or slow event handlers. This guide explains why your INP score is high and how to fix it.
What INP measures and why it matters
INP measures the time between a user interaction (click, tap, key press) and the next visual update on the page. It replaces FID (First Input Delay) and is part of Core Web Vitals.
INP thresholds:
— below 200 ms — good;
— 200 to 500 ms — needs improvement;
— above 500 ms — poor.
A high INP means the page feels unresponsive. Users may click again, tap the wrong element, or leave. INP affects user experience and is a ranking signal.
Reason 1: long JavaScript tasks
Long JavaScript tasks block the main thread and delay responses to user interactions. This is the most common cause of high INP.
What to check:
— are there long tasks in the Performance panel;
— are there large JavaScript bundles;
— is there unnecessary JavaScript on the page;
— are there third-party scripts blocking the main thread.
The fix: reduce JavaScript, split code, defer non-critical scripts, and remove unused libraries.
Reason 2: slow event handlers
Event handlers that run heavy code on click, tap or key press delay the visual update. Even small delays add up and increase INP.
What to check:
— are event handlers doing heavy work;
— are there synchronous API calls in handlers;
— are there large DOM updates in handlers;
— are handlers attached to many elements.
The fix: move heavy work out of event handlers, use requestIdleCallback or setTimeout, and debounce or throttle frequent events.
Reason 3: heavy rendering and layout
Large DOM updates, layout recalculation and heavy CSS can delay visual updates after interactions. This increases INP.
What to check:
— are there large DOM changes on interaction;
— are there forced synchronous layouts;
— are there heavy CSS animations;
— are there large lists rendered at once.
The fix: batch DOM updates, avoid forced synchronous layouts, use transforms instead of layout properties, and virtualize long lists.
Reason 4: third-party scripts
Third-party scripts — analytics, ads, chat widgets, social embeds — often run on the main thread and can delay interactions.
What to check:
— which third-party scripts are loaded;
— whether they block the main thread;
— whether they are loaded synchronously;
— whether they are necessary.
The fix: load third-party scripts asynchronously, defer non-critical ones, and remove scripts that are not needed.
Reason 5: slow server responses for interactions
If interactions trigger server requests, slow responses can delay the visual update and increase INP.
What to check:
— are interactions triggering API calls;
— how long do those calls take;
— are there blocking calls;
— is there caching for frequent requests.
The fix: optimize server responses, cache frequent requests, and show optimistic UI updates while waiting for the server.
For a broader check of requests and resources, HTTP requests checker can help identify heavy requests that contribute to slow interactions.
How to diagnose INP
A practical sequence:
— open PageSpeed Insights or Lighthouse;
— check the INP score;
— use the Performance panel to find long tasks;
— check event handlers for heavy work;
— check third-party scripts;
— check server responses for interactions;
— test on real devices.
Chrome DevTools has an "Interactions" track that shows which interactions are slow and what caused the delay. This is the fastest way to find the cause.
For a broader audit of Core Web Vitals and speed factors, SEO audit can help verify LCP, CLS, INP and other metrics in one place.
How to fix INP
Fix steps:
— reduce JavaScript bundle size;
— split code and defer non-critical scripts;
— move heavy work out of event handlers;
— debounce or throttle frequent events;
— batch DOM updates;
— avoid forced synchronous layouts;
— load third-party scripts asynchronously;
— optimize server responses;
— test after each change.
FAQ
Why is my INP score high?
Most often because of long JavaScript tasks, slow event handlers, heavy rendering, third-party scripts or slow server responses.
What is a good INP score?
Below 200 ms is good. 200 to 500 ms needs improvement. Above 500 ms is poor.
How is INP different from FID?
FID measured only the delay before the first interaction. INP measures the full interaction, including processing and visual update, across the whole page lifecycle.
Does INP affect SEO?
Yes. INP is part of Core Web Vitals, which Google uses as a ranking signal. A high INP can reduce rankings.
How do I find long tasks?
Use Chrome DevTools Performance panel. Long tasks are highlighted and show which scripts caused them.
Can third-party scripts cause high INP?
Yes. Third-party scripts often run on the main thread and can delay interactions. Load them asynchronously and remove unnecessary ones.
What about event handlers?
Heavy event handlers delay visual updates. Move heavy work out of handlers, use debounce or throttle, and avoid synchronous API calls.
Can CSS cause high INP?
Heavy CSS animations and forced synchronous layouts can delay visual updates. Use transforms instead of layout properties and batch DOM updates.
How long does it take to improve INP?
Changes take effect immediately in the browser, but Core Web Vitals data in Search Console may take weeks to update. Test locally first, then monitor.
What if INP is high only on mobile?
Mobile devices have slower CPUs and less memory. Reduce JavaScript, optimize rendering and test on real devices, not just emulators.